What-If Analysis & Model Comparison
Two powerful modules in one workspace. What-If Analysis lets you explore model behavior interactively. Model Comparison provides a 20-tab diagnostic workspace with SHAP, PDP, ROC curves, fairness metrics, and more across all your models.
Key Capabilities
Everything you need to get the most out of this module.
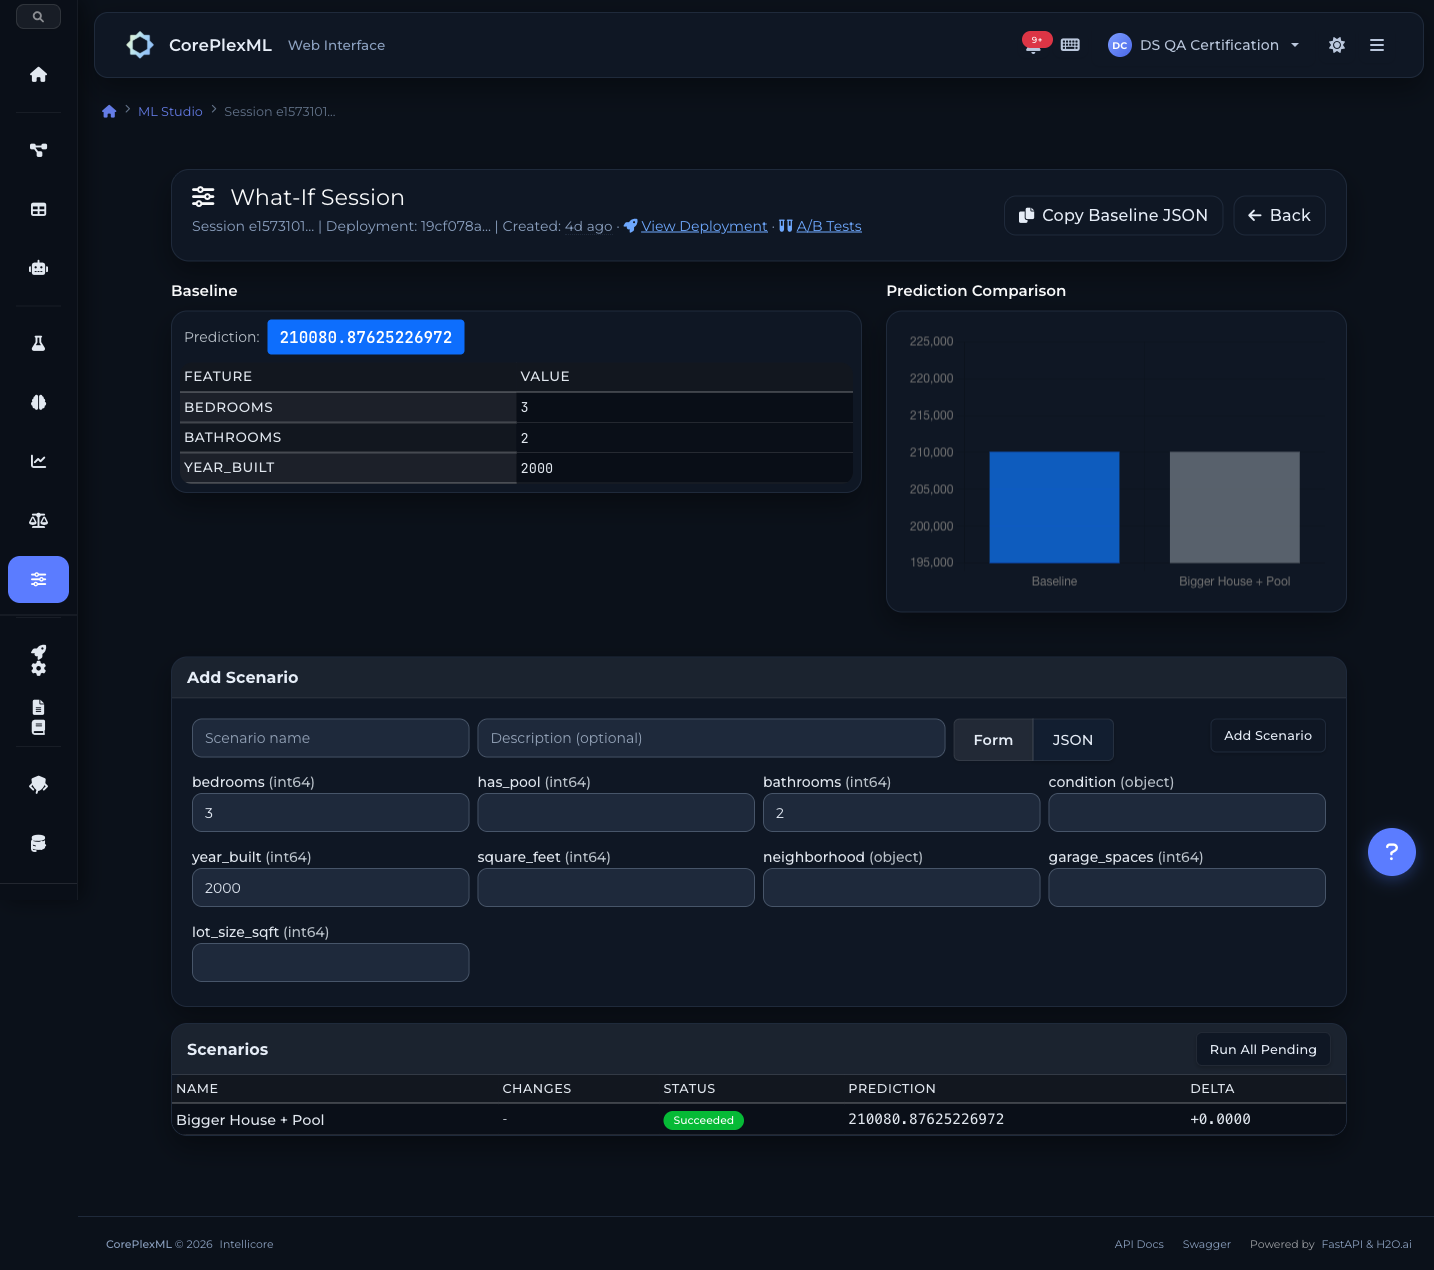
What-If Scenarios
Compare baseline vs modified scenarios side-by-side. See exactly how changes affect predictions with SHAP explanations.
Model Comparison
Full diagnostic workspace with 20 analysis tabs across 6 categories. Compare up to 10+ models simultaneously.
Explainability Suite
SHAP analysis, LIME explanations, variable importance, partial dependence plots, and feature interactions.
Advanced Analytics
ROC curves, confusion matrices, calibration plots, learning curves, fairness metrics, and ensemble builder.
What-If Analysis
Explore model behavior interactively. Change input features, create scenarios, and compare predictions with SHAP explanations — no code required.
Select a deployed model and provide baseline input values. The system automatically generates an input form from your dataset schema.
Modify feature values to create alternative scenarios. Change age, income, credit score — any input — and name each scenario for easy reference.
Run all scenarios against the deployed model. View side-by-side predictions with delta values showing exactly how each change impacts the outcome.
SHAP contributions reveal which features drive each prediction. See per-feature impact with directional indicators for business-friendly explanations.
Supports all prediction types
Numeric outputs with SHAP contributions
Probability + class label with explanations
All class probabilities + predicted class
What-If scenario analysis
Scenario comparison with SHAP contributions
Model Comparison Workspace
A full diagnostic workspace with 20 analysis tabs across 6 categories. Select models from any experiment, compare them simultaneously, and make data-driven decisions about which model to deploy.
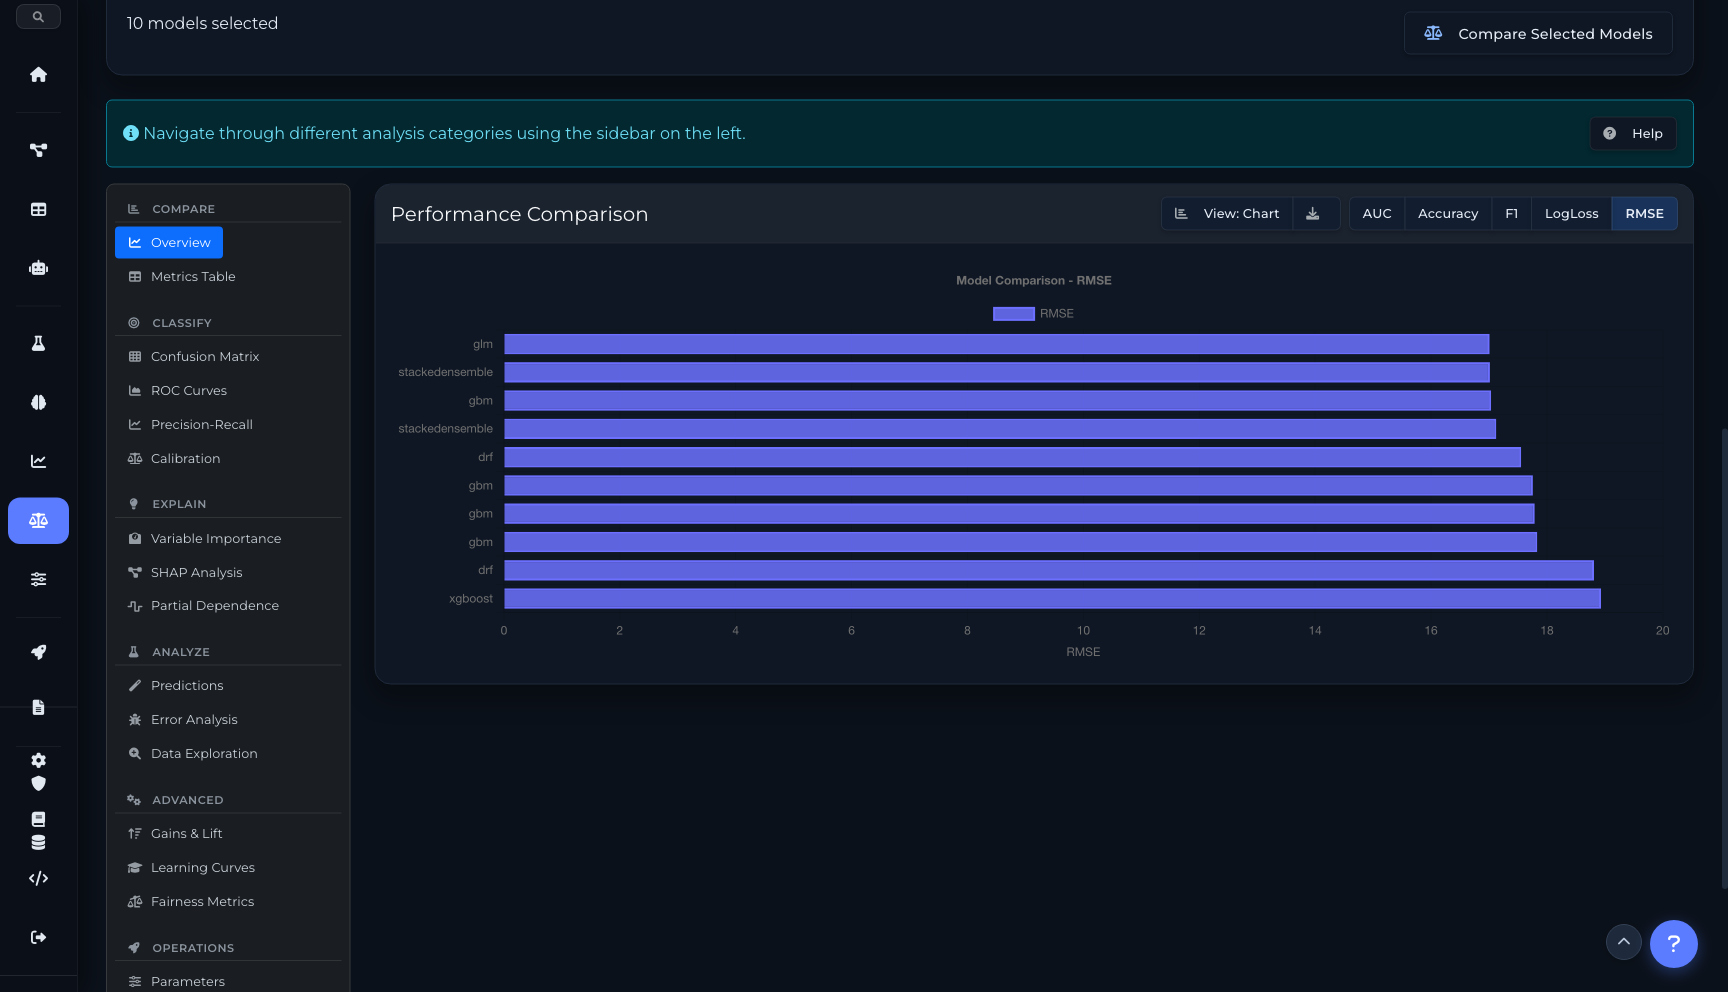
Compare
2 tabsPerformance chart comparing all models on AUC, Accuracy, F1, LogLoss, or RMSE. Toggle between chart and table view.
Complete metrics matrix — MAE, MSE, RMSE, RMSLE, AIC, training time, and more — across every model in one exportable table.
Classify
4 tabsSide-by-side confusion matrices for each model. Visualize true/false positives and negatives at a glance.
Receiver Operating Characteristic curves overlaid for direct comparison. AUC values annotated per model.
PR curves showing the precision-recall trade-off for each model, critical for imbalanced datasets.
Calibration plots showing how well predicted probabilities match actual outcomes. Identify overconfident or underconfident models.
Explain
3 tabsGrouped bar chart showing feature importance rankings across all models simultaneously. Spot which features matter most.
SHAP feature impact with bar, violin, and beeswarm plot types. Per-model SHAP values with individual feature explanations.
1D PDP, 2D interaction heatmaps, and ICE plots. See how each feature influences predictions across its range.
Analyze
3 tabsActual vs. predicted scatter plots and residual analysis. Identify patterns in prediction errors.
Error distribution by feature value ranges. Find where your model struggles and why.
Feature distribution histograms and correlation analysis. Understand the data your models were trained on.
Advanced
3 tabsCumulative gains and lift charts for evaluating model effectiveness at different population percentiles.
Training vs. validation performance as data size increases. Diagnose overfitting, underfitting, and data sufficiency.
Demographic parity, equal opportunity, and disparate impact metrics. Audit models for bias across protected groups.
Operations
4 tabsFull hyperparameter comparison table. Diff configurations across models to understand what drives performance differences.
Build custom weighted ensembles from selected models. Optimize weights and evaluate the combined model.
Latency, throughput, and resource usage metrics for deployed models. Compare operational characteristics.
Complete experiment lineage — dataset version, training config, runtime, and metric evolution over time.
Model Comparison workspace
Performance comparison chart (10 models, 5 metrics)
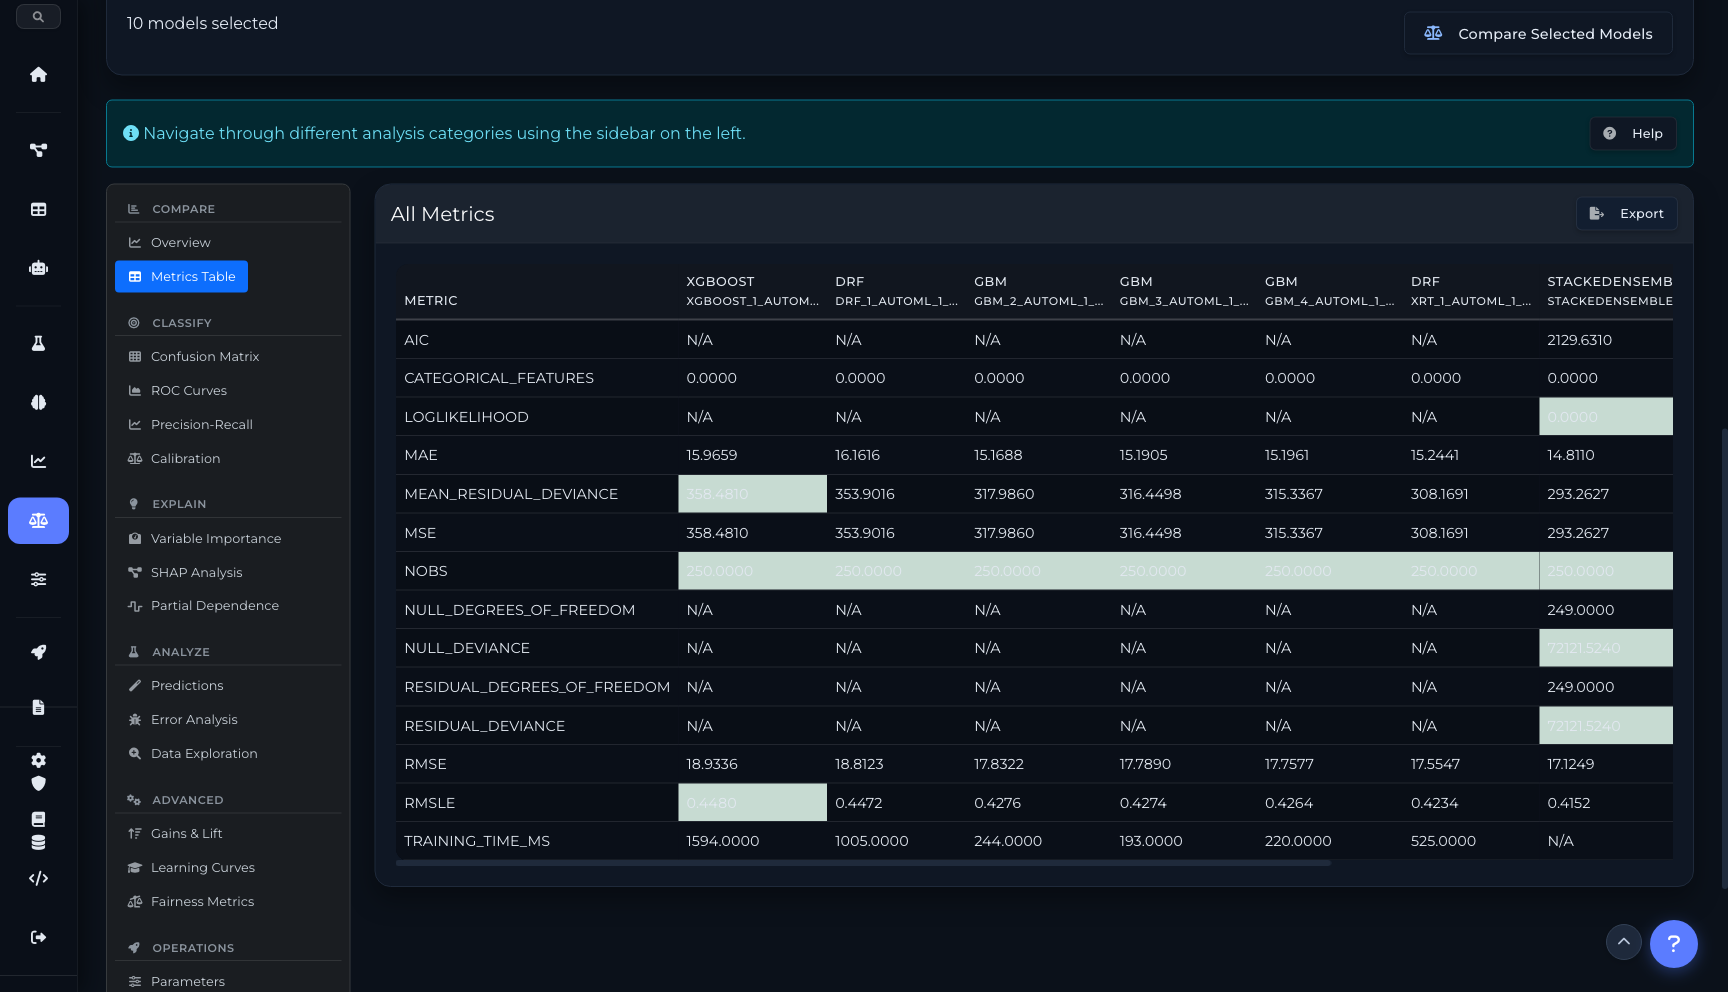
Complete metrics table with export
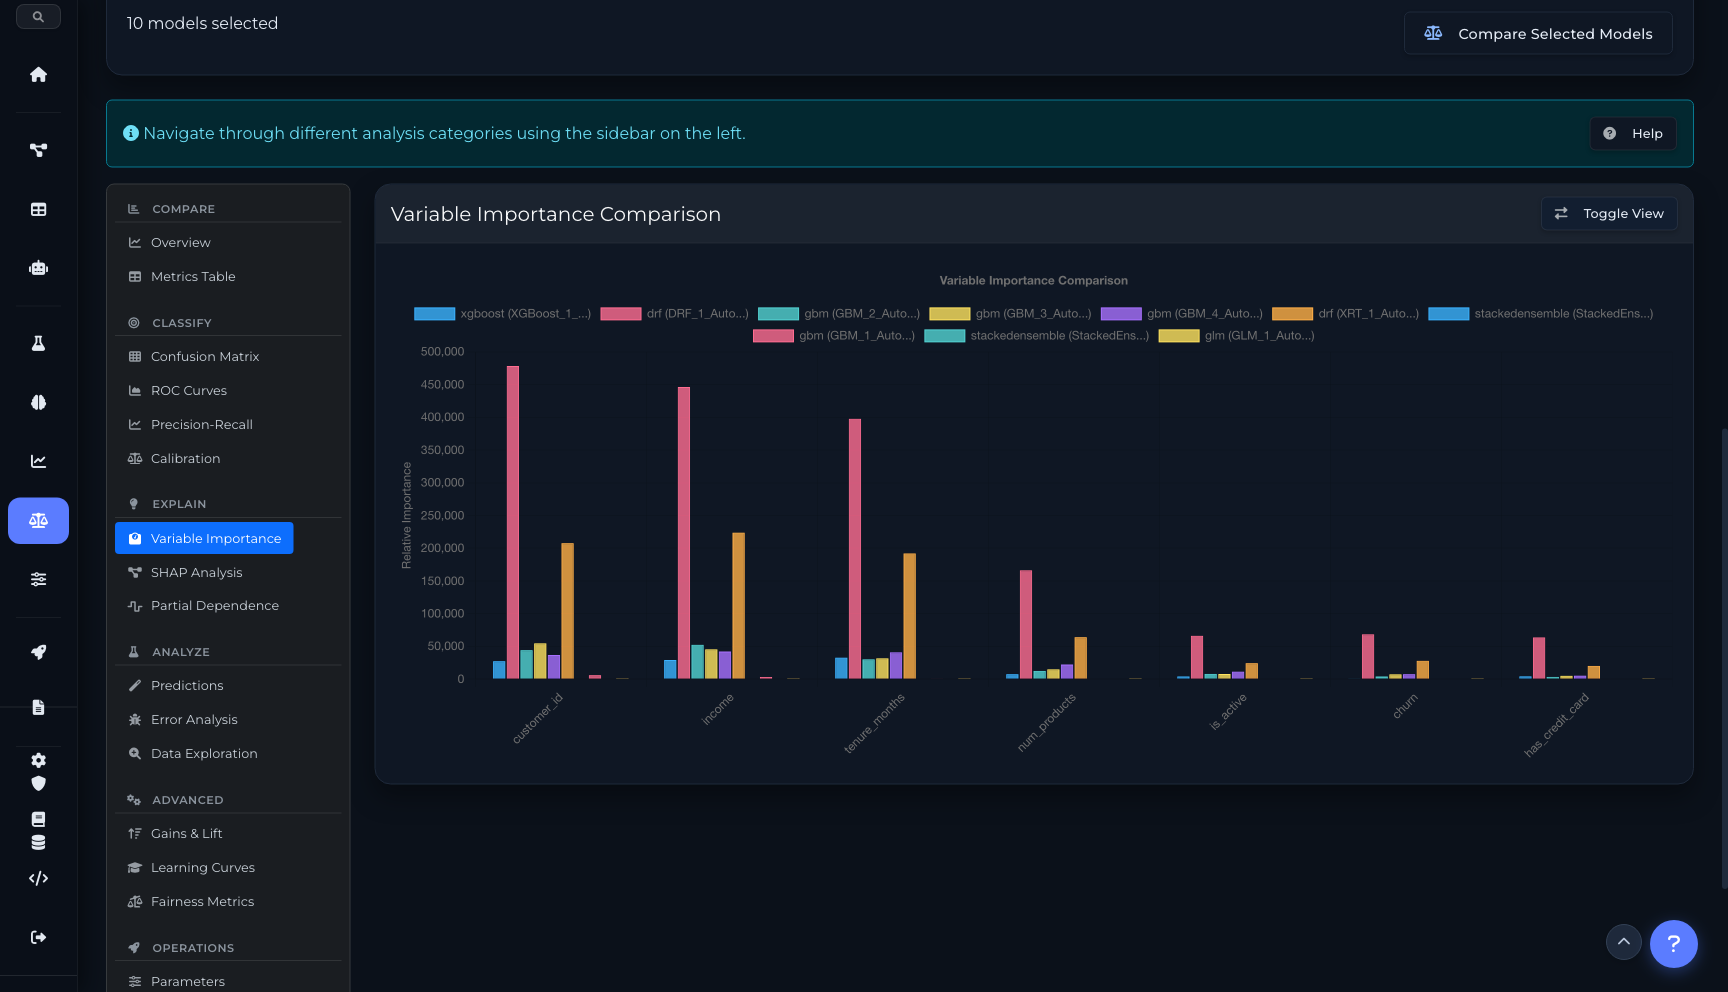
Variable importance comparison across models
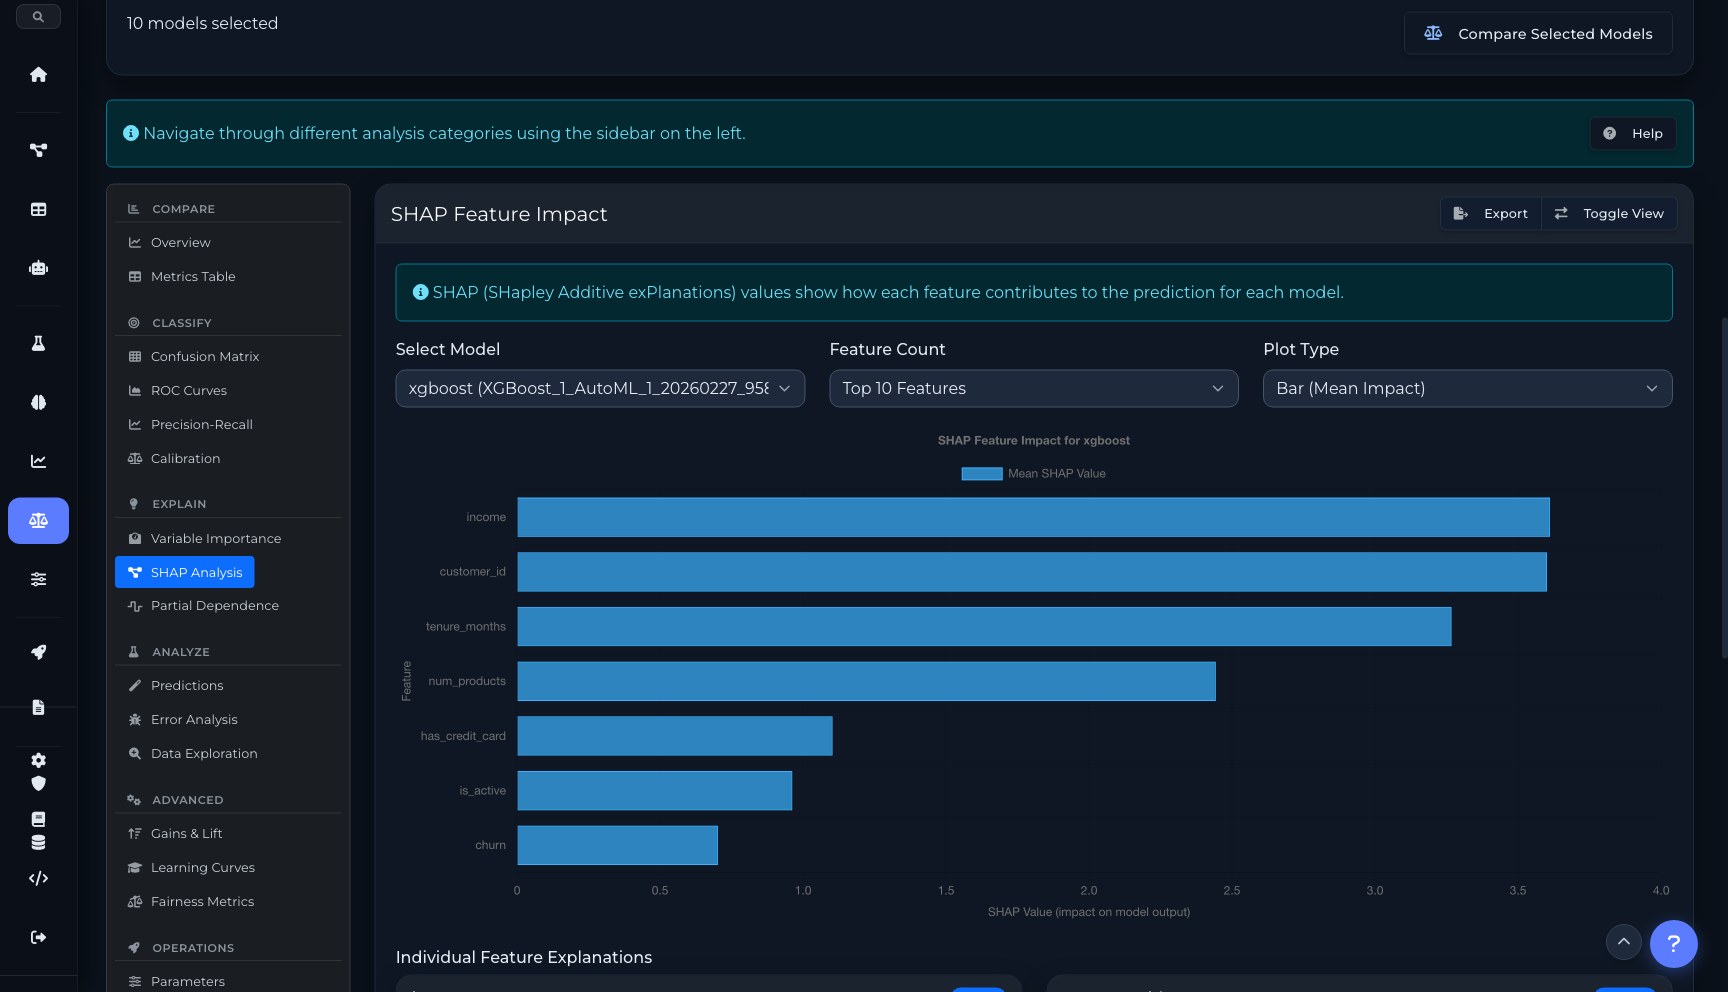
SHAP analysis with feature impact and LIME explanations
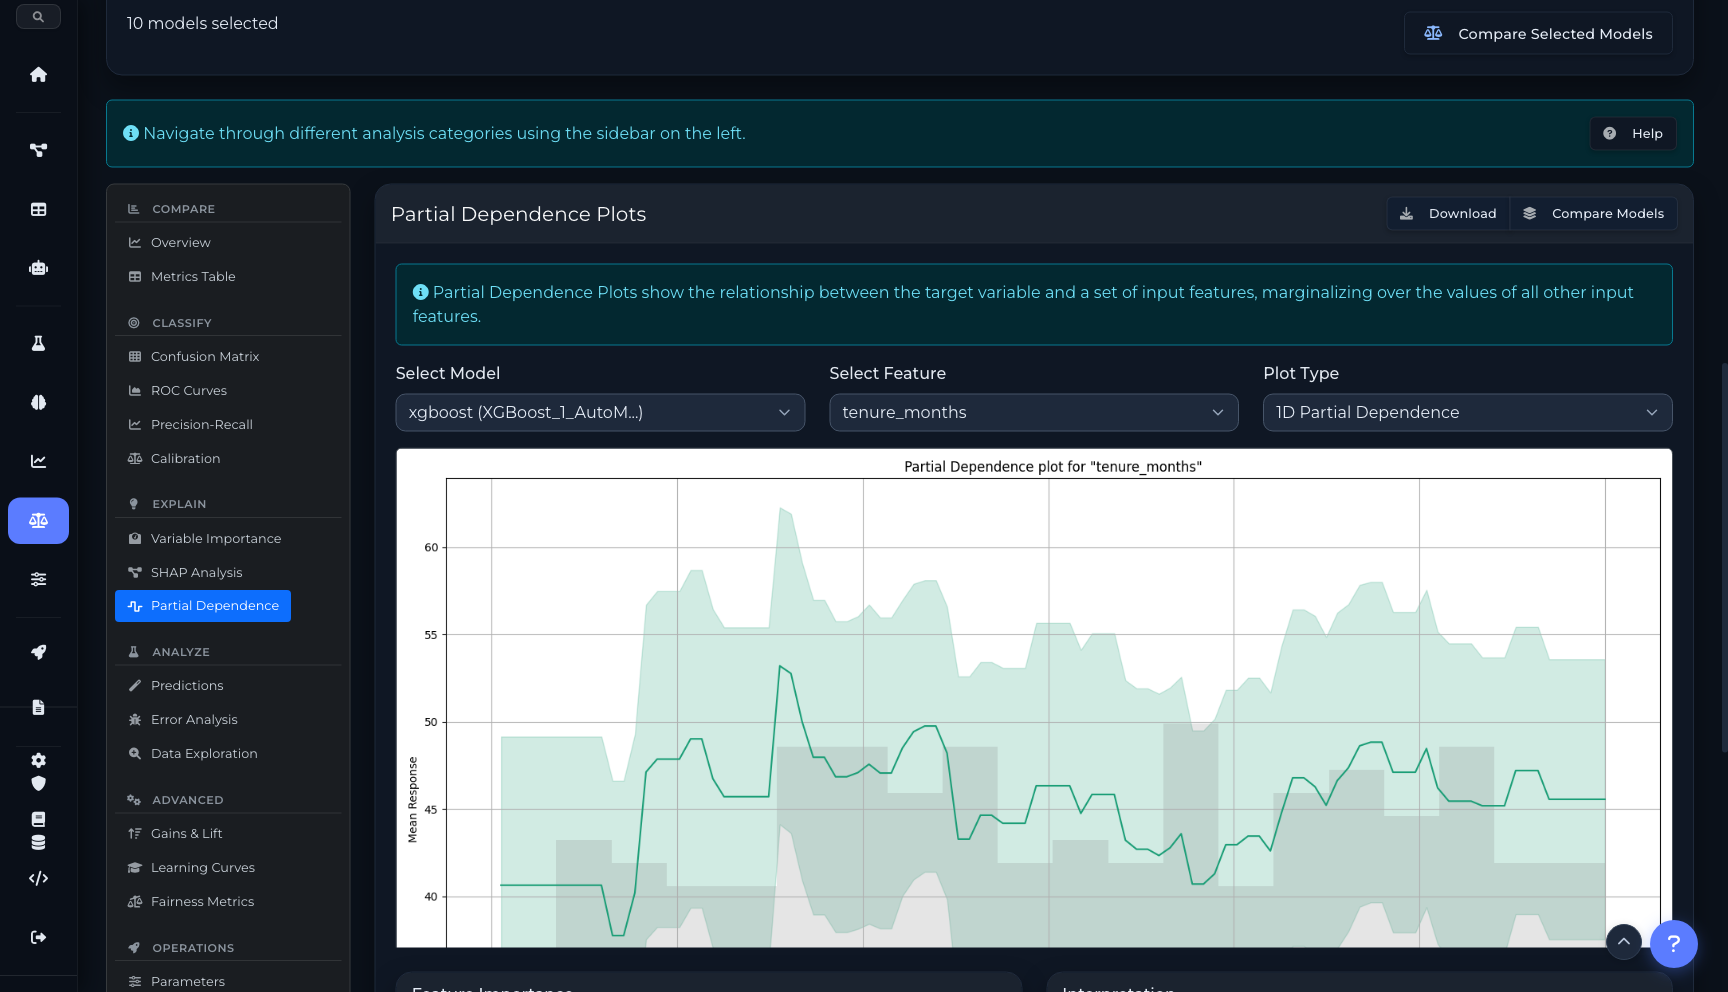
Partial dependence with 1D, 2D heatmap, and ICE modes
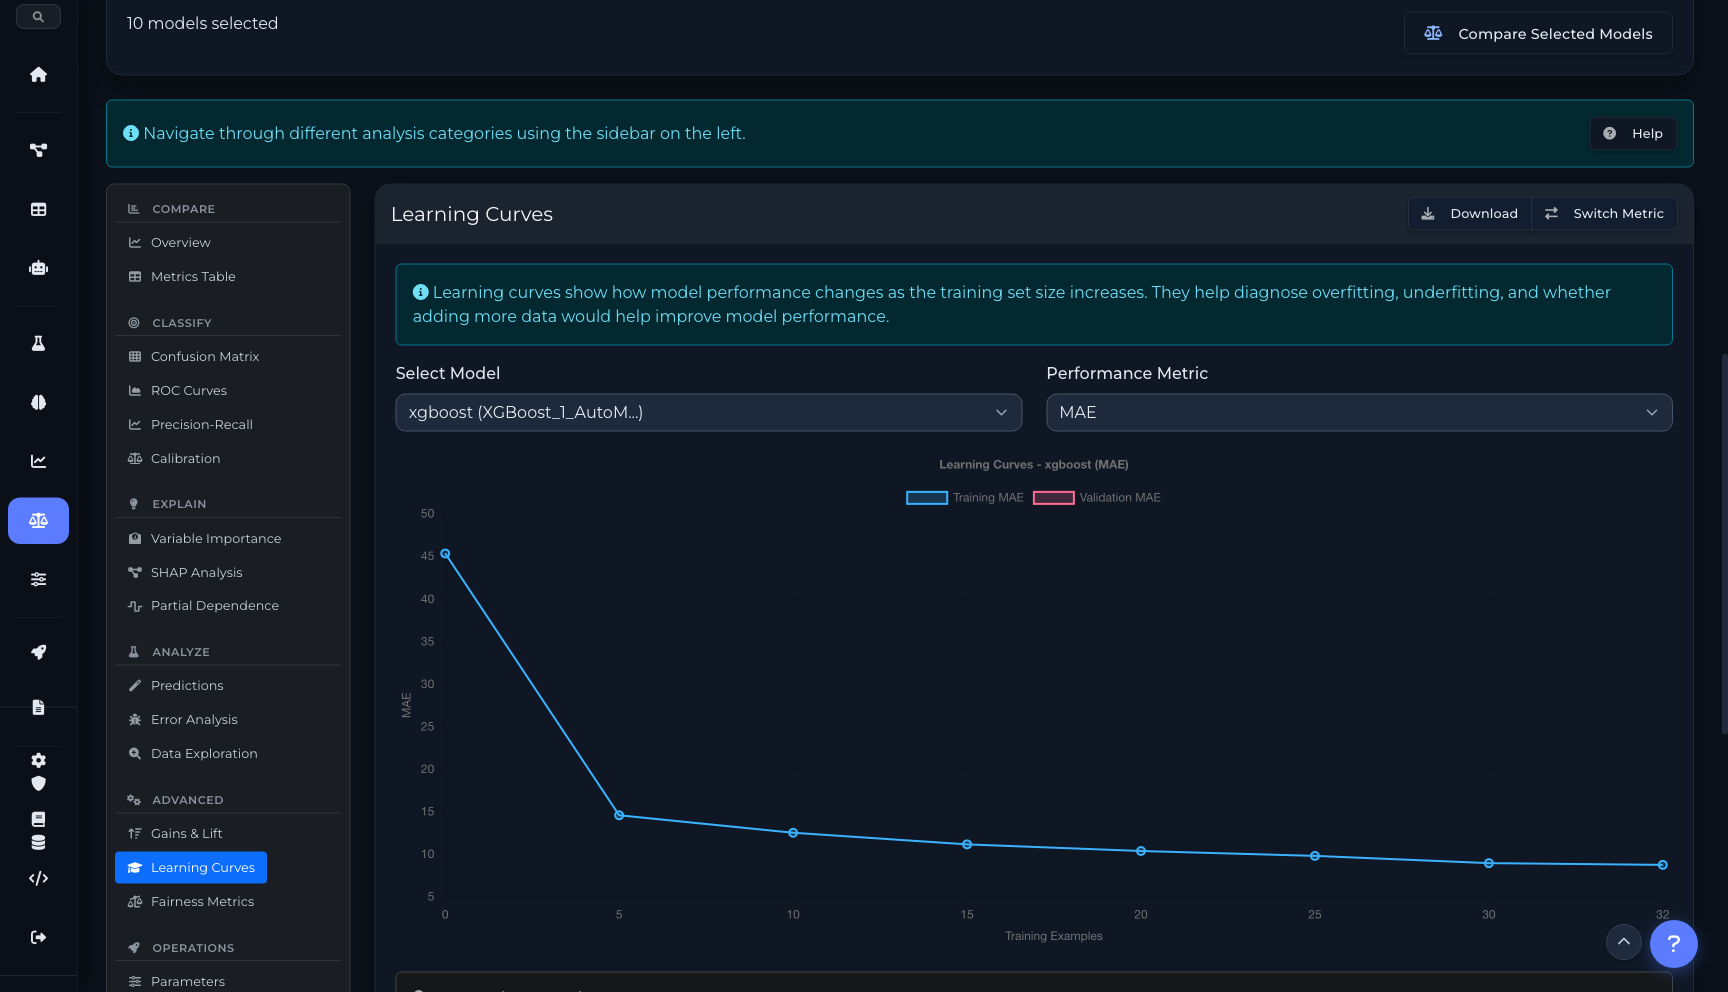
Learning curves with overfitting/underfitting diagnosis
Analysis across industries
From loan underwriting to manufacturing quality — use What-If scenarios and model comparison to make better decisions.
Loan Underwriting
Use What-If to test how income or credit score changes affect approval. Use Compare to select the best model from dozens of candidates with fairness auditing.
Insurance Pricing
Compare model candidates on calibration plots to ensure accurate premium predictions. Run What-If scenarios for different risk profiles.
Customer Churn
Compare models on ROC and precision-recall curves for imbalanced churn data. Use SHAP to explain which factors drive churn predictions.
Healthcare Outcomes
Run fairness metrics across demographic groups. Use PDP plots to understand how treatment dosage affects predicted outcomes.
Fraud Detection
Compare model performance at different thresholds using gains/lift charts. What-If testing for edge-case transactions.
Manufacturing Quality
Use learning curves to determine if more training data would help. Build optimized ensembles from multiple model types.
Automate with the SDK
Both What-If sessions and model comparison data are available programmatically through the Python SDK.
from coreplexml import CorePlexMLClient

client = CorePlexMLClient(
    base_url="https://api.coreplexml.io",
    api_key="sk_your_api_key"
)

# Create a What-If session
session = client.studio.create_session(
    project_id="proj_abc",
    deployment_id="dep_fraud_v2",
    baseline_input={
        "amount": 150, "merchant": "grocery",
        "hour": 14, "country": "US"
    }
)
print(f"Baseline prediction: {session['baseline']['prediction']}")

# Add high-risk scenario
scenario = client.studio.create_scenario(
    session_id=session["id"],
    name="High-risk transaction",
    changes={"amount": 9500, "hour": 3, "country": "NG"}
)

# Run and compare
result = client.studio.run_scenario(scenario["id"])
print(f"Scenario: {result['prediction']} (delta: {result['delta']:+.2%})")# Model Comparison API
models = client.models.list(
project_id="proj_abc",
experiment_id="exp_t1",
limit=10
)
# Get metrics for comparison
for model in models["items"]:
metrics = model["metrics"]
print(f"{model['algorithm']}: "
f"RMSE={metrics.get('rmse', 'N/A')}, "
f"MAE={metrics.get('mae', 'N/A')}")
# Get SHAP values for a model
shap = client.models.get_shap(
model_id="mod_xgb_v2",
feature_count=10
)
for feat in shap["features"]:
print(f" {feat['name']}: {feat['mean_impact']:.4f}")
# Get variable importance comparison
varimp = client.models.get_variable_importance(
model_id="mod_xgb_v2"
)
# Get partial dependence plot data
pdp = client.models.get_pdp(
model_id="mod_xgb_v2",
feature="tenure_months",
nbins=20
)ML Studio API
Endpoints for What-If sessions, scenario management, model metrics, SHAP analysis, partial dependence, and experiment leaderboards.
/api/studio/sessionsCreate a What-If analysis session with baseline input
/api/studio/deployments/{id}/schemaGet input schema for auto-generating forms
/api/studio/sessions/{id}/scenariosCreate a new scenario with modified feature values
/api/studio/scenarios/{id}/runExecute scenario and get prediction with SHAP
/api/studio/sessions/{id}/compareCompare all scenarios side-by-side with deltas
/api/modelsList models with filters for project, experiment, algorithm
/api/models/{id}Get model details, metrics, and hyperparameters
/api/models/{id}/variable-importanceGet variable importance rankings for a model
/api/models/{id}/shapGet SHAP feature impact values (bar, violin, beeswarm)
/api/models/{id}/pdpGet partial dependence plot data (1D, 2D, ICE)
/api/models/{id}/contributionsGet per-prediction SHAP contributions
/api/experiments/{id}/leaderboardGet ranked model leaderboard with metrics
Ready to get started?
Start building with CorePlexML today. Free tier available — no credit card required.